Lifecycle and Monitoring
Studio lets you manage runtime processes from the canvas without leaving the graph context.
Service Toolbar States
Each service node has a compact process toolbar for disable/start, activate/stop, sync, and restart actions.
| Status | Screenshot | Meaning |
|---|---|---|
| Not Run | 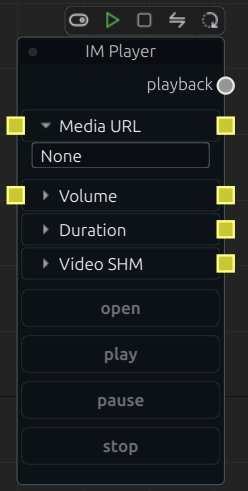 |
Process not started |
| Disabled | 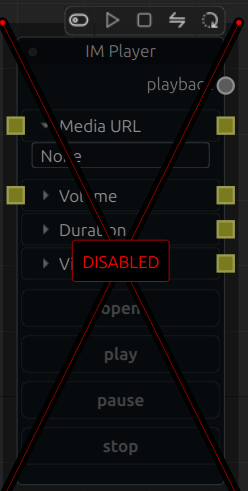 |
Excluded from compile, deploy, and auto-start |
| Running | 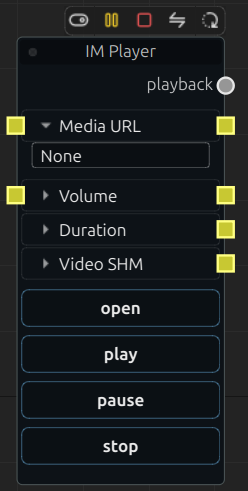 |
Process is alive |
| Paused | 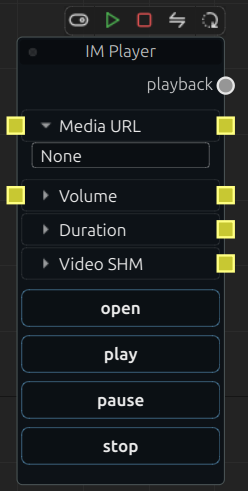 |
Process is alive but inactive |
Deploy Flow
- Edit the graph on canvas
- Validate required state fields and host-service bindings
- Compile the runtime graph
- Send the compiled rungraph to target services
- Watch service monitor rows and logs for acceptance or rejection
Monitoring Views
Service Manager is the central dashboard for runtime health. Watch these first:
- CPU/RAM/GPU usage spikes
- latency and tick drift
- error counters and repeated failures
- alive/ready/active transitions after deploy
Good Operational Habits
- Start with infrastructure services first, then hosts such as
f8.pyengine, then downstream producers/consumers. - Restart only the service that owns the failure when possible.
- Keep
Disablednodes in the graph for experiments, but avoid leaving them wired into production scenarios without notes.